Working with Spatial Data
Much of the work you do in creating maps will be spent preparing data. A rule of thumb is that 80% of your time will be spent preparing data and 20% of your time will be spent making the map. That rule, if anything, is an understatement about the amount of time spent preparing data. Understanding the basics of spatial data manipulation is essential if you want to be able to create maps for your own research and teaching.
Kinds of spatial data
There are several ways of classifying spatial data. We can classify them by the way the data is encoded, the coordinate reference system (or map projection) that they use, the shapes of the data, the format, and so on. After an overview of the most common formats that spatial data comes in, we will work on manipulating spatial data. As a sample data set, we will use the Natural Earth quick start kit.
Vector vs Raster
Some geospatial data is represented as vector files, while other data is represented as raster data. Raster data is like a digital photograph, in that it is a grid of cells where each cell contains some kind of information. Just like a digital photo, a raster image can only be enlarged to a certain point before it becomes blurry. Vector data, on the other hand, is a mathematical representation of lines or shapes. It can be zoomed without any loss of quality.
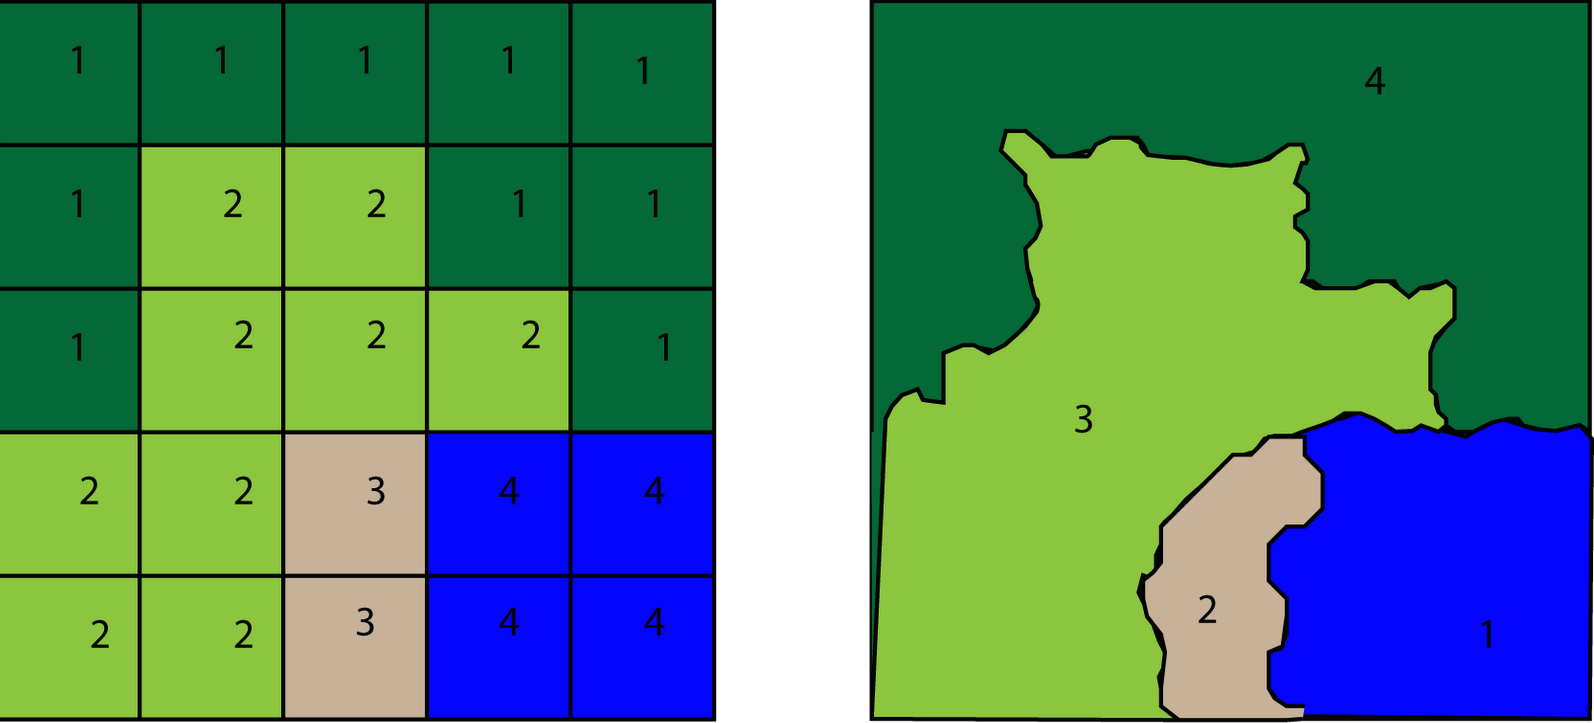
Raster data on the left; vector data on the right. Image by Michael Howser from University of Connecticut Libraries.
You are most likely to encounter raster data in the form of map images, such as .png, .jpeg, or .tiff files, or possible in the form of terrain data.1 Map images may not be associated with spatial data. But through a process called georectification, it is possible to embed spatial information within a file. The resulting files can then be loaded into a GIS program. Sometimes the resulting files have a different file extension, such as .geotiff. See inspecting spatial data to learn how to determine if an image has spatial information embedded. In the Natural Earth quick start kit, the file NE1_50M_SR_W/NE1_50M_SR_W.tif contains terrain data for the earth.
You are more likely to work with vector data. For example, other than the raster file mentioned above, all of the data in the Natural Earth quick start kit is vector data. See common spatial data formats below for more information.
Points, lines, polygons, and quantitative and qualitative information
Vector formats typically include the following kinds of information.
Point data
Point data describes a set of points. The geospatial information is likely to be encoded in terms of latitude and longitude, but it maybe encoded in a different coordinate reference system. Additional information can be associated with point data, whether that data is quantitative or qualitative. For instance, below is the North American Catholic dioceses dataset (available on the resources page) in a spreadsheet. Notice the columns for latitude and longitude are associated with temporal and qualitative information.

Point data in a CSV file, open in LibreOffice.
Here is a simple map of point data, in this case, Catholic dioceses in North America in 1850.
The easiest (and best) format to keep your own point data in is a CSV file. Point data can also be contained in shapefiles or GeoJSON files. See the file ne_110m_populated_places.shp for a shapefile containing points.
Line data
Another common form of data is line data. A line is a set of vertices (points) that are connected in sequence. This kind of data can record motion or connections. For instance, the railroad data from Railroads and the Making of Modern America is described as lines in shapefiles. Below is a map of the railroads in the United States in 1850.
Line data, like point data, can have additional information associated with it. However, if the line data is contained in a shapefile, one must see the additional properties by inspecting the attribute table at the command line or in GIS software.
Polygons
The third kind of spatial data is polygons, or areas. A polygon is a set of vertices connected by lines, where the first vertex and the last vertex are the same so that they form a closed shape. Polygons commonly hold boundary information. For example, the map below shows the United States’s boundaries in 1850.
Much of the data in the Natural Earth starter kit contains polygons. Try opening ne_110m_admin_0_countries.shp, for example, to see country boundaries. Polygon data can also be associated with other data. One must see the additional properties by inspecting the attribute table at the command line or in GIS software.
Common spatial data formats
You will find spatial data in several different common formats.
CSV, or spreadsheets
Comma-separated values files contain point data in tabular format. Sometimes this data is contained in Excel files, and should be export to CSV files as soon as possible. We have already worked with several different examples of this file format.
Shapefiles
Shapefiles are a proprietary format from ESRI, but they can be read by most mapping software. Shapefiles are comprised of several different files, which have the same filename but different extensions. The .shp file contains the geometries; the .prj file contains the projection information; the .dbf file contains additional data associated with the geometries; there may be other files as well. These files must be kept together for the shapefile to work properly.
GeoJSON
GeoJSON is an open format for spatial data. It is commonly used for web maps, though it can also be used in GIS applications. GeoJSON files can be inspected in a text editor. See Tom MacWright’s “More than you ever want to know about GeoJSON” for a detailed introduction. A single GeoJSON point might look like the following.
{
  "type": "FeatureCollection",
  "features": [
    {
      "type": "Feature",
      "properties": {
        "population": 1000000
      },
      "geometry": {
        "type": "Point",
        "coordinates": [
          -56.25,
          -1.7575368113083125
        ]
      }
    }
  ]
}Coordinate reference systems
Geospatial information is kept in terms of a coordinate reference system (CRS), an agreed-upon way of representing points on the earth. The most common of these is latitude and longitude. Latitude and longitude represents the Earth as a sphere, with a 0° of longitude that runs through Greenwich, England, and a 0° latitude that is at the earth’s equator. This system is codified in the WGS84 standard, otherwise known by the code EPSG:4326. Longitude and latitude is not the only way to represent points, however. Some spatial information, for instance, is described in the distance in meters from a certain point on the earth; others contain projected coordinates. The details of the many coordinate reference systems are not important, but one should keep in mind that data may not be in the desired CRS, and know how to convert it (see below).
An important point to keep in mind: We typically refer to “latitude and longitude.” However, in a Cartesian coordinate system the \(x\) coordinate is usually listed before the \(y\) coordinate. In a spatial system longitude is the \(x\) coordinate and latitude is the \(y\) coordinate, so some CRSes will list points in longitude, latitude format. Latitude and longitude are sometimes represented in sexagesimal (base 60) notation. For instance, the latitude and longitude of São Paulo, Brazile could be represented as 23° 33' 0" S, 46° 37' 59.8794" W. However it is always better to represent latitude and longitude in decimal degrees: 23.5500° S, 46.6333° W. Latitudes and longitudes are not stored with the notation N or S, E or W. Instead, north latitudes and east longitudes are represented as positive numbers, and south latitudes and west longitudes are represented as negative numbers. Putting longitude first, the coordinates for São Paulo would be represented as -46.6333, -23.5500.
Projections
The earth is a three dimensional object, but our maps are two dimensional. Three dimensions are reduced to two in a process called projection. Each projection makes certain compromises. Some projections distort areas but preserve bearings; others make a special effort to preserve areas. In general projections are a trade off between distortions in angles, in distance, and in area. Projections often intended to display one part of the earth, such as a region or continent, at the expense of distorting the rest of the earth. As an example of a mistake in not taking account of projections, see this description of a retraction from The Economist about the range of North Korean missiles.
Consider this common projection:

Compared to this projection of the earth:

See Jason Davies’s “Map Projection Transitions” to see many of the possible map projections. Or try the Mercator Puzzle to get a sense for how the Mercator projection distorts area.
If you have the option, you will want to pick an appropriate projection for your maps. The appropriate projection will depend on whether it is more important to preserve areas or distances, and on which parts of the earth you are mapping.
Tiles
Many of the web maps that we have been working with use tiled base layers, where a grid of images are pulled from a server and stitched together to create a layer. Try the example below, where a border has been added to Open Street Map tiles, so you can see the individual images.
Tiled layers are generally available as a web service. For instance, Open Street Maps are available at URLs with this format, http://a.tile.openstreetmap.org/{z}/{x}/{y}.png. See the tiles section of the georectification page for more information.
Manipulating spatial data
We have already seen how to inspect data in QGIS by looking at the attribute tables. QGIS will also let you save files in a different format (e.g., saving a shapefile as GeoJSON) and reproject data. But it can be more reliable to use the command line GDAL/OGR set of tools to manipulate spatial data. Below are a handful of the most useful commands using GDAL/OGR. For these examples, we will use the same shapefile (US_county_1890.shp) that we used in the QGIS lesson. After downloading that file from NHGIS or the resources page, you will want to open your terminal. On a Mac this is called Terminal.app. (You may wish to read these quick introductions to the command line: “The ProfHacker Guide to the Command Line” and “Getting Comfortable on the Command Line.”) You will then have to navigate to the directory with the shapefile using the cd (change directory) command. On my computer that looks like this, though your file will be saved somewhere different.
cd ~/dev/spatial-workshop/data/nhgis0040_shapeInspecting spatial data
You can use ogrinfo to inspect a shapefile (or other vector format). The following command will inspect our shapefile:
ogrinfo -so -al US_county_1890.shpThe resulting output looks like this:
INFO: Open of `US_county_1890.shp'
      using driver `ESRI Shapefile' successful.

Layer name: US_county_1890
Geometry: Polygon
Feature Count: 2799
Extent: (-5440149.201866, -1337508.077280) - (2258224.796357, 4591616.256563)
Layer SRS WKT:
PROJCS["USA_Contiguous_Albers_Equal_Area_Conic",
    GEOGCS["GCS_North_American_1983",
        DATUM["North_American_Datum_1983",
            SPHEROID["GRS_1980",6378137.0,298.257222101]],
        PRIMEM["Greenwich",0.0],
        UNIT["Degree",0.0174532925199433]],
    PROJECTION["Albers_Conic_Equal_Area"],
    PARAMETER["False_Easting",0.0],
    PARAMETER["False_Northing",0.0],
    PARAMETER["longitude_of_center",-96.0],
    PARAMETER["Standard_Parallel_1",29.5],
    PARAMETER["Standard_Parallel_2",45.5],
    PARAMETER["latitude_of_center",37.5],
    UNIT["Meter",1.0]]
DECADE: String (4.0)
NHGISNAM: String (50.0)
NHGISST: String (3.0)
NHGISCTY: String (4.0)
ICPSRST: String (3.0)
ICPSRCTY: String (4.0)
ICPSRNAM: String (50.0)
STATENAM: String (25.0)
ICPSRSTI: Integer (10.0)
ICPSRCTYI: Integer (10.0)
ICPSRFIP: Real (17.5)
STATE: String (3.0)
COUNTY: String (4.0)
PID: Real (19.8)
X_CENTROID: Real (19.8)
Y_CENTROID: Real (19.8)
GISJOIN: String (8.0)
GISJOIN2: String (7.0)
SHAPE_AREA: Real (19.11)
SHAPE_LEN: Real (19.11)
Notice several important pieces of information. We learned that this is a shapefile with a single layer name US_county_1890, that it contains polygons, that there are 2799 features. We also learn the extent of the shapefile, though the extent is reported in projected coordinates. We learn that the projection is "USA_Contiguous_Albers_Equal_Area_Conic". And we all see the names and types of all of the columns of data in the shapefile. For instance, the name of the STATE is a String (or set of characters).
Reprojecting
This shapefile is using a projection suitable for the continental United States. However for many uses it is easier to have the shapefile in latitude and longitude coordinates. We will convert this shapefile to the WGS84/EPSG:4326 coordinate reference system. We can do that with the ogr2ogr utility, which will convert the shapefile and save it to a new file. Notice that the name of the new file comes first, and the name of the source file comes second. The flag -t_srs EPSG:4326 tells the utility which CRS we want.2
ogr2ogr -t_srs EPSG:4326 -overwrite US_county_1890_reprojected.shp US_county_1890.shpYour directory will now have a new shapefile named US_county_1890_reprojected.shp. We can inspect this new shapefile the same way that we inspected the original.
ogrinfo -so -al US_county_1890_reprojected.shpHere is part of the output from that command:
Layer name: US_county_1890_reprojected
Geometry: Polygon
Feature Count: 2799
Extent: (-179.147340, 24.521051) - (179.778480, 71.389613)
Layer SRS WKT:
GEOGCS["GCS_WGS_1984",
    DATUM["WGS_1984",
        SPHEROID["WGS_84",6378137,298.257223563]],
    PRIMEM["Greenwich",0],
    UNIT["Degree",0.017453292519943295]]
Notice that the coordinates are not reported in degrees of latitude and longitude, and that the CRS is GCS_WGS_1894, which is what we wanted.
Simplifying
This shapefile is about 74 MB. It is so large because it stores much more detail about county boundaries than we are likely to need. Below is part of the shapefile containing information about the Gulf of Mexico. As you can see, it contains far more information than we would ever need to display if we are creating a map at the level of the nation or the region.

This shapefile has far more detail than we need. Here we are zoomed in on the Gulf of Mexico.
The size of this shapefile may make working with it prohibitively slow, and it will be too large to upload to services like CartoDB. What we need to do is to simplify the lines so they do not contain excessive detail, and perhaps remove unnecessary polygons such as small islands. For an explanation of how spatial line simplification works, see Mike Bostock’s dynamic “Line Simplification” example.
Simplification is tricky, however, because we can easily oversimplify the map. A common problem is that the boundaries of two polygons that share a boundary will be simplified differently, so that gaps or slivers are introduced. This is particular a problem with simplifying shapefiles in GIS software like QGIS.
The best tool that I have found to simplify shapefiles is Map Shaper. Map Shaper lets you upload a file and then dynamically decide on the level of simplification. Below is the same region of the Gulf of Mexico simplified so that we are keeping only 1% of the spatial data. Though this looks blocky at this level of zoom, it looks perfectly acceptable when zoomed out to the scale of the nation. The resulting file is only 4 MB: a huge savings.

The same polygons simplified by keeping only 1% of the spatial information.
When you download the file, you can overwrite the existing shapefile or keep a copy under a different name. Keep in mind, though, that the shapefile needs its associated files to keep track its projection and other data. If you rename the shapefile to something like US_county_1890_simplified.shp, then you will need to make copies of the .dbf, .prj, .shx and other files with the same name as well.
If you wish to simplify polygons or lines at the command line, ogr2ogr does provide a method. But because it does not take account of topology (i.e., it does not know that boundaries are shared by polygons) you are better off using the mapshaper command-line interface or the topojson command-line interface.
Converting formats
You can convert vector data from one format to another using ogr2ogr. In this case, we will convert our simplified and reprojected shapefile to GeoJSON.
ogr2ogr -f "GeoJSON" US_county_1890.geojson US_county_1890_simplified.shpThere are other kinds of raster spatial data. For example, scientists might have temperature data about the earth’s surface in a raster format. In general, however, humanists are less likely to encounter raster data in this form.↩
You may get a number of warnings about the precision of the values in the shapefile; these can be safely ignored.↩